Case Studies: Superannuation
Smart superannuation strategies can help you set yourself up for a great retirement
There are a number of strategies that can help you maximise your super savings.
The following case studies provide just two examples.
Case study 1: Salary sacrifice
John earns $75,000 pa and his tax rate is 30%. He wants to put away an extra $5,000 a year towards his retirement, but he’s not sure whether the tax advantages to be gained from investing in super are worth tying his money up. His other option is to invest outside super.
John has heard about salary sacrifice, a strategy where you ask your employer to take extra money out of your pre-tax salary and contribute it to super. As well as boosting your super, this strategy also reduces your taxable income, so you pay less income tax.
John decides to compare how much he could save by salary sacrificing $5,000 into super, with how much he could save by investing the same amount outside super. For the purposes of this example, we’ve assumed that both investments would provide a return of 7.7% pa.
After 20 years John’s savings could be:
Inside super: $97,186
Outside super: $64,039
That’s an extra $33,777 if John salary sacrifices into super.
Here’s how it works:
Notes: This table is for illustrative purposes only and does not represent actual returns. A change in one or more variables and assumptions will produce different results. This is general information only and does not take into account your individual objectives, financial situation or needs. This table illustrates the position after 20 years of taking $5,000 pa of before-tax salary and either salary sacrificing it into super or taking it as cash salary and investing outside of super. It assumes investment earnings of 7.7% pa, after fees and before tax. Super investment earnings and contributions are taxed at 15%. Non-super investment earnings are taxed at a marginal tax rate of 34%. All figures are in today’s dollars, adjusted for inflation of 3% pa.
Case study 2: Investing in growth assets
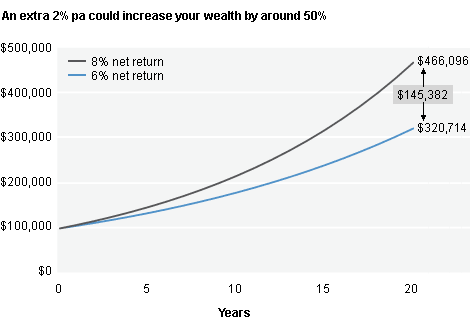
Helen and Christian each want to invest $100,000 into superannuation. Helen chooses a conservative option with a projected earning rate of 6% pa. Christian is a bit more relaxed and opts for a growth-oriented option, which contains specific growth assets such as shares and property and has a projected return of 8% pa. While his projected return is higher than that of the conservative portfolio Helen has chosen, which invests mostly in cash and fixed interest, Christian’s choice involves more risk.
Because super is a long-term investment, Christian thinks he has plenty of time to ride out any ups and downs in the markets. He believes that growth assets are likely to be more effective in building a decent retirement nest egg and while there are some risks involved, he’s willing to accept short-term volatility in return for higher returns over the long term.
Helen and Christian ask their financial adviser to compare the two options. The adviser’s comparison shows that after 20 years Christian’s $100,000 investment would grow to $466,096 while Helen’s balance would be $320,714 . A difference of just 2% pa in performance resulted in Christian’s growth portfolio accumulating $145,382 more than Helen’s conservative portfolio.

Notes: Source: Colonial First State. This chart is for illustrative purposes only and does not represent actual or expected returns for any particular funds. A change in one or more of the variables or assumptions listed will produce different results. Generally, the higher the potential return, the greater the risk of investment loss. This chart compares assumed returns of 6% pa and 8% pa (after fees and taxes) over 20 years on a starting balance of $100,000. Results are not adjusted for inflation. Please note that over long periods of time, inflation can substantially reduce the purchasing power of your money.
Disclaimer: These case studies are for illustrative purposes only and are based on specific assumptions. Outcomes will vary depending on individual circumstances and assumptions used. They are not to be taken as personal advice and are intended to provide general information only. They do not take into account your individual needs, objectives or personal circumstances.
This web page may contain general advice. You should consider talking to a financial adviser before making a financial decision.
Sound advice is the key to success
As you can see from these case studies, an experienced financial adviser can help you identify the areas of greatest risk to your situation. John Bellas Financial Services Pty Ltd offers knowledge, expertise and experience in this area. We’ll take the time to understand your individual circumstances and then recommend appropriate insurance strategies to help protect your family and assets.
Make an Enquiry
If you would like to discuss your situation or make an enquiry, please contact us through our contact form below.
